Viewing Reports
Reviewing Reports
This tutorial shows you how to review reports and move from summary to screenshots and logs to understand failures.
Before you begin
Section titled “Before you begin”- At least one run has completed.
- You can open the Reports list and the linked run details page.
- You are prepared to compare report output with screenshots or logs when needed.
What you’ll finish with
Section titled “What you’ll finish with”Understanding the results of your tests
You will know how to move from the report list to scenario detail, then use failed-step screenshots and logs only when the summary view stops being enough.
Report structure
Section titled “Report structure”Every run produces a report. Your job is to turn that report into a decision.
Think of the report in layers. Each layer answers a different question:
- Summary → Did something fail?
- Configuration → Could environment or setup explain it?
- Scenario details → What exactly broke?
- Logs / screenshots → What actually happened at runtime and what was visible at failure?
Your goal is not to read everything — it is to move layer by layer until you can confidently explain the failure.
Step by step procedure for reviewing reports
Section titled “Step by step procedure for reviewing reports”- Open
Reportsand sort or scan for the newest failed or suspicious run. - Open the report and start with the summary totals, environment metadata, and execution context.
- Drill into failed scenario rows before opening any external artifacts.
- Read the failed step names and durations to decide whether the issue looks like navigation, data setup, locator resolution, or assertion mismatch.
Common failure patterns to classify quickly:
- Navigation issue → page not loaded, wrong route, redirect problems
- Data/setup issue → missing or incorrect test data
- Locator issue → element not found, not visible, not interactable
- Assertion issue → expected result does not match actual outcome
- Open linked run logs if you need timing or runtime detail.
- Open failed-step screenshots if you need visual context for what was on screen at the failure point.
- Decide whether to fix the test, sync drift, adjust environment data, or escalate a likely product defect.
Below is a screenshot of how a typical report in AppraiseJS looks like.
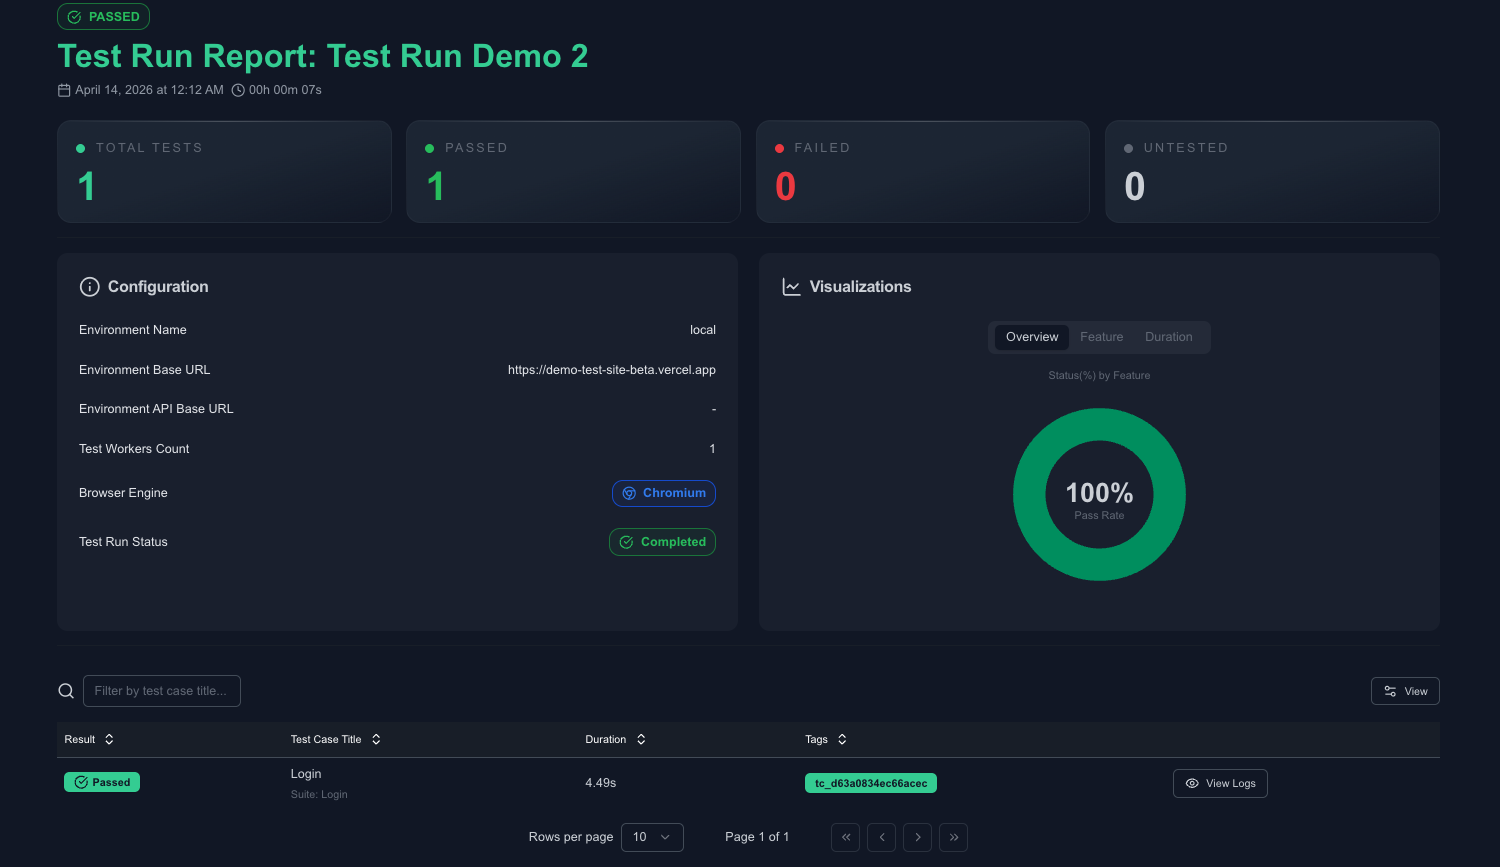
Notice how each scenario includes a view logs button that can be used to open the logs for the scenario.
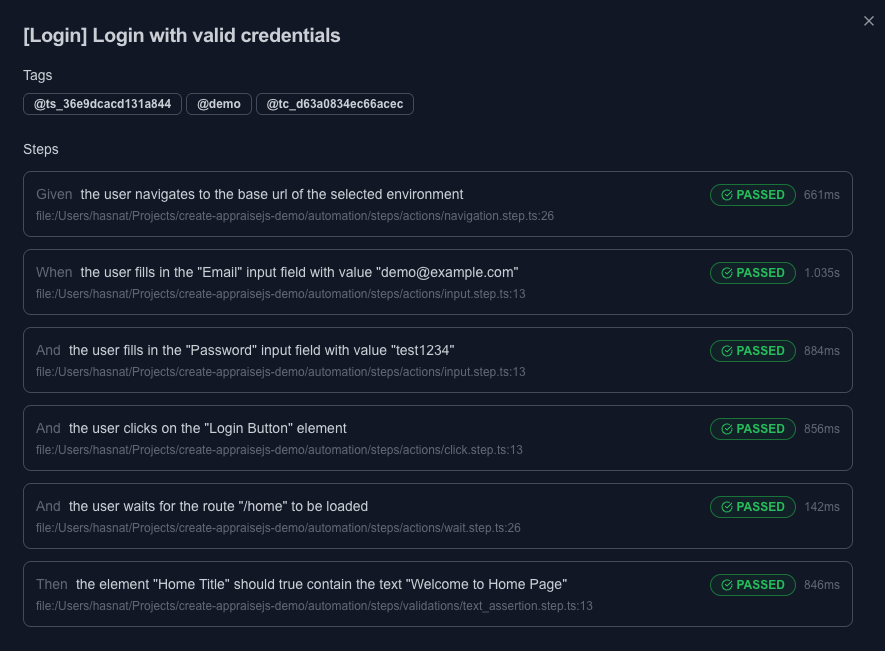
Use logs to understand the runtime details of the scenario execution and also see browser state at the failure point through screenshots.
Checkpoint
Section titled “Checkpoint”- You can explain the likely failure class before opening any deeper artifact.
- You know when the report itself is enough and when you need screenshots or logs.
- You can point to the next corrective action: edit the test, updated environment data, fix stale locators or simply rerun the test.
Common mistakes
Section titled “Common mistakes”- Treating every failure as a locator problem without reading step order and environment context first.
- Jumping straight into raw logs before checking the scenario summary and failed step name.
- Ignoring the selected environment when the route or data state looks wrong.
- Re-running immediately without first classifying whether the failure is deterministic or flaky.
Next step
Section titled “Next step”If you still cannot classify the failure, move to Troubleshooting for symptom-to-fix guidance.